Roadwurx Launches Municipal Referral Program to Reward Highway Departments for Sharing Success

Published on July 28, 2025
In local government, departments often operate in their own spheres of responsibility, public works, finance, planning, emergency services, IT, each with its own processes, tools, and performance metrics. While specialization brings efficiency, it also breeds operational silos that can hinder communication, duplication of effort, and lost opportunities for collaboration. One of the most practical ways to break down these barriers is through the implementation of shared digital dashboards.
Silos are not just an abstract problem. When departments don’t share data or insight into their activities, key outcomes suffer. For example, a finance team might not understand why a highway department is burning through its overtime budget during spring unless they have visibility into storm recovery efforts. A planning department may not realize that their proposed development site includes an area flagged for drainage improvements. Lack of communication leads to inefficiencies, rework, and even interdepartmental friction.
Shared dashboards are centralized, digital displays that provide real-time data and updates across multiple departments. They can include metrics such as budget usage, project timelines, service requests, work order completions, and asset conditions. Depending on the platform used, dashboards can be customized per user or department, while still pulling from the same data sources to ensure consistency and alignment.
Informed Decision-Making
When leadership and department heads can see the same up-to-date information, strategic planning improves. Everyone has access to the same version of the truth.
Improved Coordination
Public works can alert emergency services to upcoming road closures. Finance can track spending trends in real time. This coordination reduces operational conflicts and redundant communication.
Enhanced Accountability
When metrics are visible across departments, performance becomes easier to track. Leaders can hold teams accountable based on clear, shared goals.
Faster Response Times
Cross-departmental visibility allows for quicker mobilization in response to crises or community needs. When everyone sees the same data, there’s no need to wait on reports or email chains.
Transparency with Stakeholders
Dashboards can be configured for public access or presentation at board meetings, helping to build trust with elected officials and residents by showcasing measurable progress.
Project Tracking: A shared capital projects dashboard can help finance, engineering, and planning departments align timelines, budgets, and contractors.
Maintenance Coordination: Parks, roads, and water departments can use dashboards to log and schedule asset maintenance, reducing duplication and improving service delivery.
Grant Compliance: Tracking milestones and expenditures in a single dashboard ensures all stakeholders stay on top of documentation and deadlines.
Start Small: Begin with a few key metrics that matter across departments, such as work order volumes, response times, or budget spend, and grow from there.
Involve Stakeholders Early: Let department heads help define what data they need and what they’re willing to share.
Use Role-Based Access: Ensure that sensitive data is only visible to appropriate users, while still promoting overall transparency.
Choose the Right Tool: Many municipal software vendors now offer built-in dashboards. Alternatively, third-party tools like Power BI, Tableau, or Google Data Studio can be linked to existing databases.
Train Staff: Even the best dashboard is useless if staff don’t know how to read or use it. Make training part of your implementation plan.
Data Compatibility: Different departments often use different systems, which may not easily integrate.
Change Resistance: Staff may be hesitant to share “their” data, fearing loss of control or increased scrutiny.
Upfront Costs: While dashboards pay off in efficiency, setting them up, especially with custom integrations, can require investment in time and technical resources.
Capital Projects Dashboard
Displays the status of infrastructure projects across departments such as engineering, finance, and planning. Includes timelines, budget spend, contractor information, and current phase (e.g., design, bid, construction).
Work Order and Maintenance Dashboard
Used by public works, parks, and facilities to show open, in-progress, and completed work orders. Helps avoid duplication and allows finance to monitor resource allocation and overtime costs.
Fleet Management Dashboard
Shares vehicle availability, service schedules, and repair needs across departments that share a fleet, such as police, sanitation, and highway crews.
Storm Response or Emergency Operations Dashboard
Combines input from public safety, highway, and emergency management to display road closures, flooded areas, equipment deployments, and power outages during weather events.
Code Enforcement and Permitting Dashboard
Shared between code enforcement, planning, and building departments to track open violations, permit application status, inspections, and follow-ups.
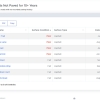
Finance and Budget Monitoring Dashboard
Provides department heads and finance staff with real-time tracking of expenditures, encumbrances, and budget variances by department or project.
Citizen Service Request Dashboard
Visualizes service requests from residents (e.g., potholes, trash issues, tree removal) submitted via 311 or similar platforms, and shows progress toward resolution by the responsible department.
Grant Management Dashboard
Tracks active grants, reporting deadlines, performance milestones, and spending across departments that share responsibility for compliance and reporting.
Water and Utility Dashboard
Displays metrics on water main breaks, meter reading compliance, stormwater inspections, and usage trends for coordination between water, stormwater, and environmental departments.
HR and Training Compliance Dashboard
Shared by HR and department managers to track mandatory training completion, certifications, and onboarding progress for new hires.
Each of these dashboards can be customized by role, access level, and relevance, and they are most powerful when they integrate with underlying systems (e.g., ERP, GIS, work order platforms) to update in real time.
Municipal dashboards can be built either in-house or through third-party software, and the right approach depends on the size of the municipality, internal IT capacity, and budget. Here's a breakdown of both options and a list of software platforms that offer pre-built or easily configurable dashboard tools:
Some municipalities, especially larger ones with IT staff and business analysts, choose to build custom dashboards using tools like:
Microsoft Power BI
Integrates with Excel, SQL databases, and many ERP systems. Ideal for creating interactive visual dashboards across departments.
Google Data Studio (now Looker Studio)
A free and cloud-based dashboarding tool that works well with Google Sheets and BigQuery for lightweight, collaborative dashboards.
Tableau
A powerful data visualization platform that can create highly customized dashboards. Requires licenses and technical expertise.
These tools give you full control but require data integration work and staff time to manage.
Many modern SaaS platforms designed for local governments include dashboard functionality out-of-the-box. These options typically integrate different modules (e.g., finance, permitting, asset management) and allow for role-based visibility:
OpenGov
Offers financial transparency dashboards, budgeting and performance management dashboards, and capital project tracking tools.
Cartegraph
Strong in asset and work order tracking. Dashboards display service requests, asset conditions, and maintenance workload across departments.
Tyler Technologies (Munis and Enterprise ERP Suite)
Includes dashboards for financials, HR, payroll, permitting, and citizen engagement metrics.
Cityworks
GIS-centric platform that offers dashboards tied to asset management, permitting, and public works activities.
Accela Civic Platform
Includes dashboards for permitting, inspections, and code enforcement. Useful for community development and building departments.
ClearGov
Specializes in budget transparency and planning. Offers visual dashboards for capital planning and performance management.
GovPilot
Provides shared dashboards for code enforcement, service requests, permits, and departmental performance.
Smaller municipalities may benefit from SaaS tools with pre-configured dashboards, as they require less technical expertise and can be implemented quickly.
Larger cities or counties with more complex needs or legacy systems may prefer building custom dashboards to unify disparate data sources.
Hybrid models are also common - using SaaS dashboards for specific tasks while creating custom Power BI or Tableau dashboards to fill in gaps or bridge across platforms.
In any case, the key to success is less about the software itself and more about organizational willingness to share data, define useful metrics, and align on goals. Dashboards are only as valuable as the collaboration behind them.
Shared dashboards are more than just software tools, they represent a cultural shift toward openness, coordination, and data-informed government. Municipal leaders who embrace this shift will find themselves better equipped to tackle complex problems that span across departmental boundaries. From managing large infrastructure projects to responding to public health events or natural disasters, the ability to see and share key data in real time is no longer optional, it’s essential.
While dashboard functionality is increasingly built into modern municipal software platforms, success depends less on the technology itself and more on an agency’s willingness to collaborate and align on shared goals. A siloed team with a dashboard is still a siloed team. It’s the cross-departmental mindset that brings these tools to life.

Roadwurx Launches Municipal Referral Program to Reward Highway Departments for Sharing Success
Why Every Road Department Should Use Asset Management Software

Breaking Silos: Using Shared Dashboards for Cross-Departmental Visibility

5G + Edge Computing for Adaptive Traffic Signals
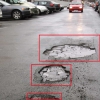
Computer Vision Pothole Detection

Open-Source Alternatives: When They Make Sense