Roadwurx Launches Municipal Referral Program to Reward Highway Departments for Sharing Success

Published on June 23, 2025
*Note - SaaS = Software as a Service
Why TCO Matters
Sticker price is only Year-1 cash outlay. Municipal boards often see the first-year subscription or license and assume that’s the cost.
TCO captures everything you’ll pay, or lose, over time. Implementation, training, staff backfill, upgrades, downtime, and even contract‐exit fees frequently eclipse the initial quote.
Better budget forecasting and vendor selection. Comparing vendors on TCO levels the playing field and keeps “low-ball” proposals from winning on price alone.
| Direct & Visible | Indirect & Often Hidden |
|---|---|
| Licensing / Subscription – annual per-user or site fees; tier upgrades | Internal Labor – project management, subject-matter experts, overtime |
| Implementation Services – data migration, integrations, vendor PS | Change Management & Training – courseware, travel, lost productivity |
| Maintenance & Support – mandatory support tiers, patches | Downtime & Disruption – go-live slowdowns, unplanned outages |
| Hardware / Cloud – servers, storage, additional SaaS seats | Risk & Compliance – audit prep, penalties avoided/ incurred |
| Future Upgrades – major version jumps, module add-ons | Exit / Re-procurement – data export, parallel ops, contract penalties |
Define the horizon. Most municipalities use 5 years for SaaS and 7–10 years for on-prem systems to match depreciation schedules.
Estimate usage growth. Will user counts or data volumes rise 3 % per year? Build that in.
List every cost line item under the categories above. Interview finance, IT, and end-user departments so hidden costs surface.
Spread costs by year. Implementation peaks in Year 0–1, while support, hosting, staffing, and upgrade costs recur.
Apply an inflation or escalation rate (e.g., 3 %/yr) to recurring costs—and don’t forget vendor price-rise clauses.
Discount to Net Present Value (NPV). Use your finance office’s standard discount rate (often 3–5 %) so Year-10 dollars equal today’s dollars.
Add risk buffers. A 10 – 15 % contingency for scope creep, change orders, or missed deadlines keeps surprises out of the general fund.
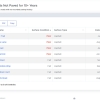
| Cost Component | Yr 0 (Impl.) | Yr 1 | Yr 2 | Yr 3 | Yr 4 | 5-Year Total |
|---|---|---|---|---|---|---|
| Licensing (25 users) | — | $30 000 | $31 200 | $32 448 | $33 746 | $127 394 |
| Implementation & Data Migration | $45 000 | — | — | — | — | $45 000 |
| Training & Change Mgmt. | $12 000 | $3 000 | $1 500 | $1 500 | $1 500 | $19 500 |
| IT & Cloud Hosting | — | $8 000 | $8 240 | $8 487 | $8 741 | $33 468 |
| Internal Labor (backfill) | $20 000 | $5 000 | $5 000 | $5 000 | $5 000 | $40 000 |
| Planned Upgrade (new module) | — | — | — | $10 000 | — | $10 000 |
| Contingency (15 %) | $11 | — | — | — | — | $11 000 |
| Total (undiscounted) | $88 000 | $46 000 | $45 940 | $57 435 | $48 987 | $286 362 |
In this real-world-style budget, the first‐year sticker price of $30,000 represents barely 10 % of the 5-year TCO.
Pay now vs. later. High up-front implementation may be worthwhile if the vendor offers lower long-term subscription escalators.
Risk exposure. A tight 5-year TCO can balloon if the vendor’s roadmap forces a costly “Version 2” migration in Year 3.
Opportunity cost. Budget tied up in support for a legacy tool could fund innovative projects instead.
Negotiate multi-year price caps (≤ 3 % escalator) before signing.
Leverage cooperative purchasing groups to cut initial fees 10–20 %.
Phase non-critical modules until Year 2-3, spreading costs and lessons learned.
Mandate open data formats so exporting data at end-of-life is quick and cheap.
Invest in staff training early. Better adoption means fewer vendor help-desk calls.
Use visuals. Charts showing cumulative spend help council members grasp the long game.
Compare at least two vendors side-by-side on TCO, not just Year-1 bids.
Highlight avoided costs. For example, showing how a cloud solution eliminates $60 000 in future server replacements frames the investment positively.
Tie TCO to service outcomes. A higher-priced but more reliable system may save thousands in avoided overtime and citizen complaints.
Sticker price is seductive, but municipalities live with software far longer than one budget cycle. A disciplined TCO analysis, spanning licensing, implementation, maintenance, labor, risk, and exit costs, ensures you select the solution that delivers the best value over its full life-span, not just the lowest bid on paper.
Need a quick calculator? Drop the cost categories above into a spreadsheet, add a simple NPV formula, and you’ll have a defensible TCO model ready for your next procurement meeting.

Roadwurx Launches Municipal Referral Program to Reward Highway Departments for Sharing Success
Why Every Road Department Should Use Asset Management Software

Breaking Silos: Using Shared Dashboards for Cross-Departmental Visibility

5G + Edge Computing for Adaptive Traffic Signals

Computer Vision Pothole Detection

Open-Source Alternatives: When They Make Sense